Monday, September 22, 2014

Google Trends and stock indexes

The return of a stock index is the sum of the individual returns of the consituents. Is there a similar relationship for search words. I.e. is the searches for "FTSE 100" similar to the average searches for the index constituents?

The black line is the searches for "FTSE 100". The red line is the average search volume for companies in the FTSE 100 index. The data has been detrended and missing values have been interpolated.

There doesn't seem to be much of a correlation between the two. Nevertheless, a regression reveals that the relationship is statistically significant, allthough the magnitude is very small with a coefficeint of 0.039 (16.011).

We can conclude that there is no economically meaningful correlation between the two.


Thursday, September 18, 2014

FTSE implied volatility compared to daily Google Searches

One of the findings that Vlastakis and Marekllos (2011) is that the implied volatility of S&P 500 as measured my the VIX index moves closely with what they call "market related information demand", i.e. the number of searches for "S&P 500" per week as measured by Google Trends. Figure one is taken from their research.


Since I'm doing research on FTSE 100, I thought it would be interesting to see if there is a similar relationship there. The graphs below presents my data for two time periods. Especially the second chart seem to indicate a strong relationship between the two.
 
The coefficient for the search volume is 0.18 (15.06) in the above regression.

In the longer time period, the coefficient drops to 0.08 (15.89) but remains significant on a 0.1% level. The R-squared drops more, from 30.15% in the shorter time period to 18.29% above.

The search data has been manipulated in a number of ways before it is used here.
  1. Daily data is collected in 90-day intervals and merged based on the weekly time series that is available for the entire period. In this way, the granularity of daily data is combined with the comparability across time periods provided by the weekly data.
  2. The linear trend is extracted from the search data.
  3. A day-of-the-week trend is also extracted from the data.
The impact on the data of this treatment can be seen here.

Sunday, September 14, 2014

Side by side plots of trading volume, volatility, and Google searches for selected companies

The plots below show the time series charts and scatter plots for a selection of compaines from FTSE 100. The charts plot data of trading volume, squared daily returns, and searches on Google (SVI).

FTSE 100


Aggreko

 Anglo American

 Antofagasta

 AstraZeneca

 Aviva

 Barclays

BT Group

 Carnival

CRH

 EasyJet

 Royal Dutch Shell

 Shire


Financial Research with Google Trends

Quantifying the semantics of search behavior before stock market moves
Curme, Preis, Stanley & Moat (2013)
http://www.pnas.org/content/111/32/11600.abstract


Nowcasting with Google Trends in an emerging market
Carrière-Swallow & Labbé (2013)
http://onlinelibrary.wiley.com/doi/10.1002/for.1252/full

Google attention and target price run ups
Signos (2013)
http://www.sciencedirect.com/science/article/pii/S1057521912001184

Quantifying trading behavior in financial markets using Google Trends
Preis & Stanley (2013)
http://www.nature.com/srep/2013/130425/srep01684/full/srep01684.html?ftcamp=crm/email/2013426/nbe/AlphavilleNewYork/product

Quantifying the Advantage of Looking Forward
Preis, Moat, Stanley & Bishop (2012)
http://www.nature.com/srep/2012/120405/srep00350/full/srep00350.html

Web Search Queries Can Predict Stock Market Volumes
Bordino (2012)
http://dx.plos.org/10.1371/journal.pone.0040014 

Forecasting private consumption: survey‐based indicators vs. Google trends
Vosen & Schmidt (2011)
http://onlinelibrary.wiley.com/doi/10.1002/for.1213/full

Information Demand and Stock Market Volatility
Vlastakis & Markellos (2011)
http://www.sciencedirect.com/science/article/pii/S0378426612000507

In search of attention
Da, Engelberg & Gao (2011)
http://onlinelibrary.wiley.com/doi/10.1111/j.1540-6261.2011.01679.x/full

In search of fundamentals
Da, Engelberg & Gao (2011)
http://papers.ssrn.com/sol3/papers.cfm?abstract_id=1589805

Investor information demand: Evidence from Google searches around earnings announcements
Drake, Roulstone & Thornock (2011)
http://onlinelibrary.wiley.com/doi/10.1111/j.1475-679X.2012.00443.x/full

The sum of all fears: investor sentiment and asset prices
Da, Engelberg & Gao (2010)
https://www3.nd.edu/~pgao/papers/FEARS_20131007.pdf

The determinants of international investment and attention allocation: Using internet search query data
Mondria, Wu & Zhang (2010)
http://www.sciencedirect.com/science/article/pii/S0022199610000449

Predicting the Present with Google Trends
Choi & Varian (2009)
http://onlinelibrary.wiley.com/doi/10.1111/j.1475-4932.2012.00809.x/full

Forecasting Private Consumption: Survey-based Indicators vs. Google Trends
Schmidt & Vosen (2009)
http://econpapers.repec.org/paper/rwirepape/0155.htm

Saturday, September 13, 2014

Seasonal adjustments of search data for financial applications


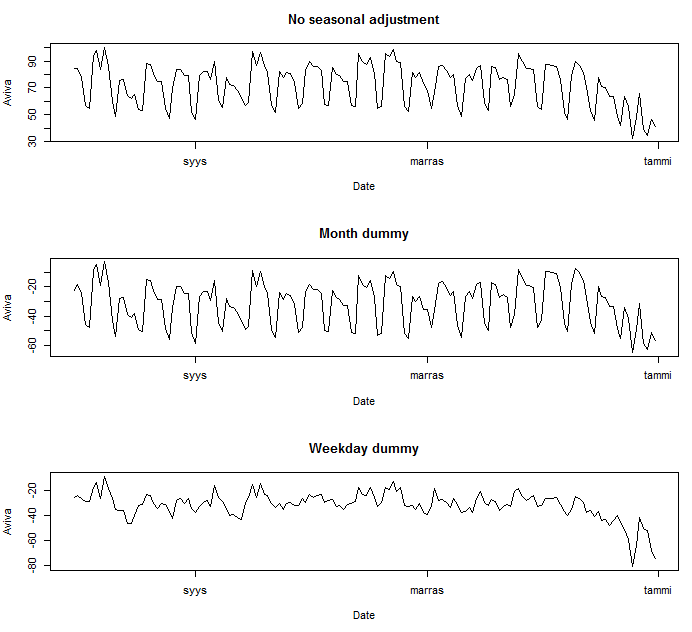
If you're using Google Trends data for statistical analysis, you will want to take a closer look at any seasonal patterns in the data. I've plotted three versions of the same search data, the raw data, the data where dummy variables for the months have been included, and one where dummy variables for the weekday ahve been included. The raw plot shows that there is a clear daily pattern in the data.

AstraZeneca

In the case of AstraZeneca, searches are the lowest during the weekend and the highest on Wednesdays.

Aviva

Aviva shares the same pattern as AstraZeneca. It seems as the interest for Aviva and AstraZeneca follows the pattern of the working week. If the search data represents financial interest, perhaps it shows that investors take the weekend off.

BHP Billiton

Also BHP Billiton exhibit the same pattern with the search volume being the lowest on the Weekends and the highest on Wednesdays. A possible rule of thumb for the quality of search volume data for financial applications could be the display of such a pattern.

BAE Systems

And finally BAE Systems, again the same pattern of low search volumes on the weekends and high search volume on Wednesdays.

FTSE 100


Thursday, September 11, 2014

How successful was the Apple Watch announcement compared to the iPhone and iPad? (Google Trends comparison)

Update 24.10: as of today, the search volume for the apple watch when compared to the iPhone and iPad has fallen to zero for the previous week. The fall is simliar to that of the other products, and indicates that the interest is significantly lower for the watch. This Fortune article lists some sales predictions made by analysts.Toni Sacconaghi, Bernstein, says that their initial estimate of 30 million units sold in the first year appears high. Gene Munster, Piper Jaffray, puts sales at 5-10 million units, closer to my estimate of 2.7 million units in the first three months of sales.

By the look of the Google Trends chart for the Apple Watch, the launch was a big success. But how does it compare to the iPhone and iPod announcements? Not very well, it turns out. I compared the relative search volumes 30 weeks before and after the product announcements, and it seems like the interest for the Apple Watch is lukewarm in comparison.


Compared to other products in the wearables category however, the Apple Watch is clearly ahead after the announcement.

The search data suggests that the Apple Watch won't be as big a hit as their other products, but Apple is likely to be a winner in the wearables category.

What can we say about their sales figures from the data?There seems to be quite a strong correlation between the search volumes and the unit sales.

A scatterplot where the search volume is lagged two quarters has the highest explanatory power. The value of this is of course questionable. But if we put our doubts asside, and assume that the sensitivity of two quarter ahead unit sales is acurate, then the Apple Watch sales should be in the region of 2.7 million units in the first quarter of sales.


Tuesday, September 02, 2014

Automate Google Trends download using R

Updated 13.10.2014

If you're using Google Trends for research or analysis, downloading the data can be time consuming. This tool uses R to automate the downloading process. The function URL_GT creates the URL for the Google Trends file export. It takes the following parameters:

keyword
A single query or a vector of queries. Google Trends does not accept more than five queries at a time.

country
If you are interested in the search volume for a specific country, add the country code here. I.e. country="US" for searches in the US.

region
If you have specified a country, you may also add a particular region in that country. Region="AL" gives you the searches in Alaska, if you have specified "US" as country.

year
If you want to get the searches for a specific year, enter year=2012 here.

month
Select the starting month by adding the months number here.

length
The parameter length specifies how many months of data to retrieve. The default is three months, as this is the maximum length for daily data. Queries for over three months will result in weekly or monthly data.

The function returns the URL for the csv download.

In order to automate the file download, you can use the downloadGT function. Add the URL to the file (as returned by the URL_GT function) and your browser's download path. The function uses your default web browser to open the link and returns the file path for the csv file.

#This script automates the downloading of Google Trends.
#It works best with firefox in combination with the Tab Mix Plus add-on that is used to automate tab closing.
#Ask firefox not to prompt for new downloads and this script should run automatically.
#Google Trends restricts the number of download to roughly 400 at a time.

URL_GT=function(keyword="", country=NA, region=NA, year=NA, month=1, length=3){


  start="http://www.google.com/trends/trendsReport?hl=en-US&q="

  end="&cmpt=q&content=1&export=1"
  geo=""
  date=""

#Geographic restrictions

  if(!is.na(country)) {
    geo="&geo="
    geo=paste(geo, country, sep="")
    if(!is.na(region)) geo=paste(geo, "-", region, sep="")
  }

  queries=keyword[1]

  if(length(keyword)>1) {
    for(i in 2:length(keyword)){
    queries=paste(queries, "%2C ", keyword[i], sep="")
    }
  }

#Dates
  if(!is.na(year)){
    date="&date="
    date=paste(date, month, "%2F", year, " ", month+length-1, "m", sep="")
  }

  URL=paste(start, queries, geo, date, end, sep="")

  return(URL)
}


downloadGT=function(URL, downloadDir){


#Determine if download has been completed by comparing the number of files in the download directory to the starting number

  startingFiles=list.files(downloadDir)
  browseURL(URL)
  endingFiles=list.files(downloadDir)

  while(length(setdiff(endingFiles,startingFiles))==0) {

    Sys.sleep(3)
    endingFiles=list.files(downloadDir)
  }
  filePath=setdiff(endingFiles,startingFiles)
  return(filePath)
}


Entertaining Blogs - BlogCatalog Blog Directory
Bloggtoppen.se