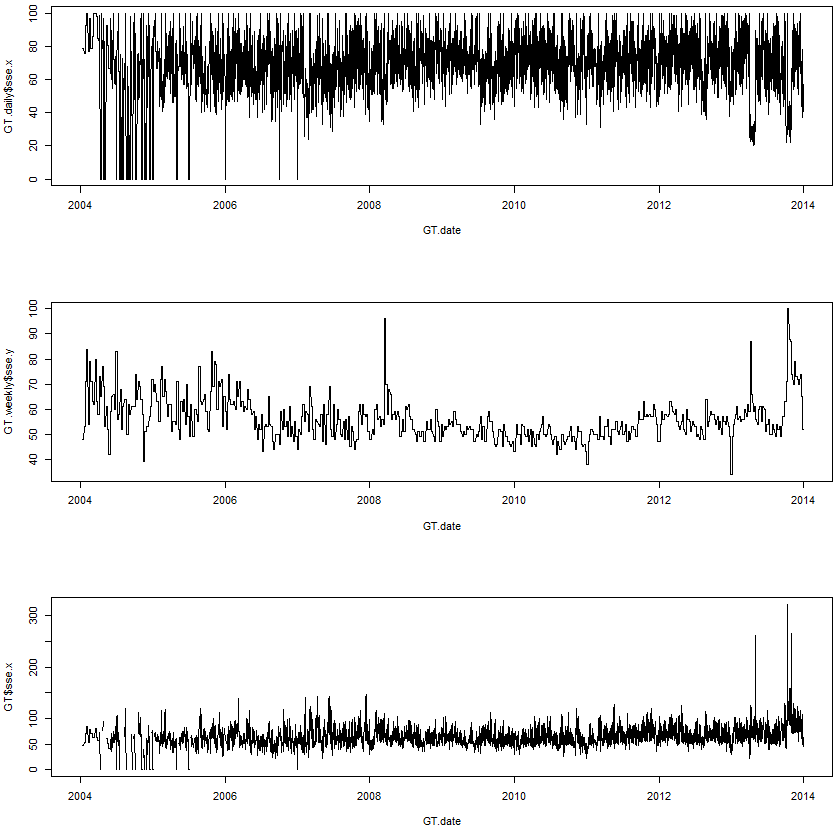
The first graph is the individual data exports with daily data mashed together (30 days at a time). The second graph is the full data export with weekly data. The last graph is the daily data that has been reindexed based on the weekly values.
Thursday, August 28, 2014
Examples: daily Google Trends data for more than 90 days
I've written about a method for merging monthly data exports from Google Trends before. Here I will show a couple of examples of how this changes the data. The source code can be found here: https://github.com/321k/Thesis.
The first graph is the individual data exports with daily data mashed together (30 days at a time). The second graph is the full data export with weekly data. The last graph is the daily data that has been reindexed based on the weekly values.
The first graph is the individual data exports with daily data mashed together (30 days at a time). The second graph is the full data export with weekly data. The last graph is the daily data that has been reindexed based on the weekly values.
Subscribe to:
Post Comments (Atom)


3 comments:
Eric, I was trying to follow your code under https://github.com/321k/Thesis. I got stuck in file Rename 2. formatGT to 2. Google Trends in line summaryTable=function(rawGT). Would you mind explaining what rawGT stands for? I'm new to R and have lot's to learn. If I were to run summaryTable(rawGT) what can I put in rawGT to execute.
Thank you,
Sure, rawGT is a list object containing all of the downloaded csv files from Google Trends. If you have already downloaded the data into a folder, then follow these steps:
#specify the file path
path"C:/downloads/google trends"
#import the data from the specified path
rawGT=importGT(path)
#create the summary table that saves the structure of the csv files
summary=summaryTable(rawGT)
#Now we have all we need to structure the data.
#formatGT creates a list object from the csv files that only contains the time series data
GT=formatGT(rawGT, summaryTable)
#If you want to put the data into a data frame, use mergeGT
GT.table=mergeGT(GT)
#Let me know if you get stuck!
Hi Erik,
Many thanks for your posts/code - I now have my own R file which automatically downloads csvs. Ideally I want monthly data from 2004 to the present day, although I can only seem to get weekly data. Is there a way of getting monthly data straight from google? Anyhow, I wrote some code to backout a monthly estimate from the weekly data, however it does not seem to correspond to the graph on the google trends website. For instance if I search Renault in France - Alsace
https://www.google.fr/trends/explore#geo=FR-A&cmpt=q&q=renault
I can see that September 2005 is the peak - however looking at the csv weekly data although Sep 05 has high values around 75, there are other months e.g. Oct 2004 where the average is higher. Am I missing something here? Why do I not get results close to the graph?
Thanks,
Steve
Post a Comment