AstraZeneca
In the case of AstraZeneca, searches are the lowest during the weekend and the highest on Wednesdays.
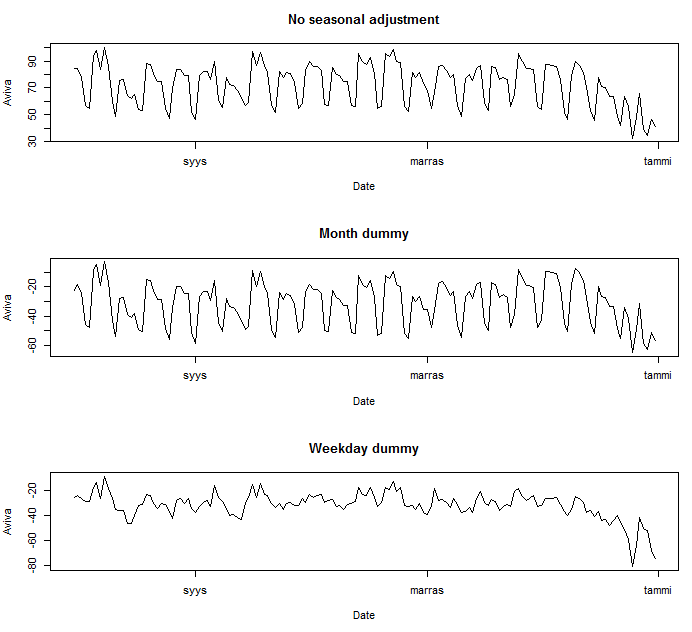
Aviva
Aviva
shares the same pattern as AstraZeneca. It seems as the interest for
Aviva and AstraZeneca follows the pattern of the working week. If the
search data represents financial interest, perhaps it shows that
investors take the weekend off.
BHP Billiton
Also BHP Billiton exhibit the same pattern with the search volume being the lowest on the Weekends and the highest on Wednesdays. A possible rule of thumb for the quality of search volume data for financial applications could be the display of such a pattern.
BAE Systems
And finally BAE Systems, again the same pattern of low search volumes on the weekends and high search volume on Wednesdays.
FTSE 100


No comments:
Post a Comment