If you're going through the Buy 'Til You Die package's walk-through, you are bound to get stuck in a couple of places. Here are fixes to some of those problems.
Page 5
Warning message:
In cbind(f, r, T) : number of rows of result is not a multiple of vector length (arg 2)
This error occurs because the walk through specifies tot.cbt as tot.cbt = dc.CreateFreqCBT(elog). This is incorrect and should be tot.cbt = dc.CreateFreqCBT(elog.cal). After making that change, the error is fixed.
Page 6
Error: could not find function "pnbd.PlotDropoutHeterogeneity"
pnbd.PlotDropoutHeterogeneity(params) doesn't work because the function name has changed. Replace it with pnbd.PlotDropoutRateHeterogeneity(params) and it works fine.
Page 8
Error in pnbd.PAlive(params, x, t.x, T.cal) : could not find function "hyperg_2F1"
If you haven't loaded the package "gsl", the function pnbd.ConditionalExpectedTransactions will throw an error. It's easily fixed by loading the gsl library.
Saturday, December 26, 2015
Monday, December 21, 2015
Currently reading: RFM and CLV: Using Iso-Value Curves for Customer Base Analysis
The R packages But 'til you die (BTYD) implements a number of customer lifetime value prediction algorithms. Here, I've collected my notes from reading the papers RFM and CLV: Using Iso-Value Curves for Customer Base Analysis and “Counting Your Customers” the Easy Way: An Alternative to the Pareto/NBD Model.
Iso-value curves allows us to group individual customers with different purchase histories but similar future valuations. Iso-curves can be visualised to show the interactions and trade-offs among the RFM measures and customer value.
The Pareto/NBD framework captures the flow of transaction s over time and a gamma-gamma submodel is used for spend per transaction.
The Pareto timing model
Hold-out tests are used to check for validity of the model.
Customer centric marketing
In non-contractual settings, forecasting the CLV is particularly challenging.
Researchers have previously developed scoring models to predict customers behaviour. The RFM model (recency, frequency, monetary value) is also common way to summarise customers' past behaviour. They fail to recognise that different customer cohorts will lead to different RFM values.
These problems can be overcome with a formal model of buyer behaviour. The authors develop a model based on the premise that "observed behaviour is a realisation of latent traits". With this insight, they can use Baye's theorem to estimate customers' latent traits.
Statistical inference is the process of deducing properties of an underlying distribution by analysis of data.
Bayesian inference is a method of statistical inference in which Baye's theorem is used to update the probability for a hypothesis as evidence.
Baye's theorem describes the probability of an event, based on conditions that might be related to the event. With a Bayesian probability interpretation the theorem expresses how a subjective degree of belief should rationally change to account for evidence, i.e. Bayesian inference.
P(A|B) = ( P(A) P(B|A) ) / P(B)
The Pareto/NBD framework assumes that the RFM variables are independent. Monetary value is independent of the underlying transaction process, which means that value per transaction can be factored out. Instead, the authors recommend focusing on the "flow of future transactions". To get the estimated customer lifetime value, we can rescale the discounted expected transactions (DET) with a multiplier. The DET is constructed with a gamma-gamma submodel.
CLV = margin * revenue / transactions * DET

The Pareto/NBM framework is based on the following assumptions.
The authors develop a formal model for lifetime value because the observed data is sparse and therefore unreliable.
These calculations give us the expected lifetime number of transactions from a customer. To calculate the lifetime value, we also need a model for the expected value of the transactions. The assumptions are:
Closed-form expression: A mathematical expression that can be evaluated in a finite number of operations. Usually, if an expression contains a limit function, it is not closed form.
Convolution: A function derived from two given functions by integration that expresses how the shape of one is modified by the other.
Instead of the log-normal distribution, they choose the gamma distribution, adapting the gamma-gamma model from Colombo and Jiang (1999).
The gamma distribution is a family of probability density distributions with two parameters. The exponential distribution and chi-squared distribution are two special cases of gamma distributions. There are three alternative parameterisations of a gamma distribution: shape and scale, shape and rate, or shape and mean.
Monetary value
Why do we need a model for monetary value at all? Isn't the mean of observed values sufficient? We cannot necessarily trust the observed value m.x because of potential outliers skewing individual results. If a customer has made a payment with a size far away from the mean, we want to debias the forecast. The monetary value of each transaction is denoted by z.1, z.2 ... z.x. As x approach infinity, the observed mean transaction value m.x approaches the true mean E(M). We expect this to be a slow process and one which the typical sparse transaction data set is far from approximating.
A marginal distribution is the probability distribution of several variables combined. The variables are also a subset of a larger set of variables. The term marginal came about because they used to be found by summing values in tables along rows or columns in the margin of the table.
Sources
“Counting Your Customers” the Easy Way: An Alternative to the Pareto/NBD Model
RFM and CLV: Using Iso-Value Curves for Customer Base Analysis
Iso-value curves allows us to group individual customers with different purchase histories but similar future valuations. Iso-curves can be visualised to show the interactions and trade-offs among the RFM measures and customer value.
The Pareto/NBD framework captures the flow of transaction s over time and a gamma-gamma submodel is used for spend per transaction.
The Pareto timing model
Hold-out tests are used to check for validity of the model.
Customer centric marketing
In non-contractual settings, forecasting the CLV is particularly challenging.
Researchers have previously developed scoring models to predict customers behaviour. The RFM model (recency, frequency, monetary value) is also common way to summarise customers' past behaviour. They fail to recognise that different customer cohorts will lead to different RFM values.
These problems can be overcome with a formal model of buyer behaviour. The authors develop a model based on the premise that "observed behaviour is a realisation of latent traits". With this insight, they can use Baye's theorem to estimate customers' latent traits.
Statistical inference is the process of deducing properties of an underlying distribution by analysis of data.
Bayesian inference is a method of statistical inference in which Baye's theorem is used to update the probability for a hypothesis as evidence.
Baye's theorem describes the probability of an event, based on conditions that might be related to the event. With a Bayesian probability interpretation the theorem expresses how a subjective degree of belief should rationally change to account for evidence, i.e. Bayesian inference.
P(A|B) = ( P(A) P(B|A) ) / P(B)
The Pareto/NBD framework assumes that the RFM variables are independent. Monetary value is independent of the underlying transaction process, which means that value per transaction can be factored out. Instead, the authors recommend focusing on the "flow of future transactions". To get the estimated customer lifetime value, we can rescale the discounted expected transactions (DET) with a multiplier. The DET is constructed with a gamma-gamma submodel.
CLV = margin * revenue / transactions * DET

The Pareto/NBM framework is based on the following assumptions.
- Customers go through two stages in their lifetime with a specific firm: They are active for some time period, and then they become permanently inactive.
- While customers are active, they can place orders whenever they want. The number of orders a customer place in any given time period appears to vary randomly around his or her underlying average rate.
- Customers (while active) vary in their underlying average purchase rate.
- The point at which a customer becomes inactive is unobserved by the firm. The only indication of this change in status is an unexpectedly long time since the customer's transaction, and even this is an imperfect indicator; that is, a long hiatus does not necessarily indicate that the customer has become inactive. There is no way for an outside observer to know for sure (thus the need for the model to make a "best guess" about this process.
- Customers become inactive for any number of reasons; thus, the unobserved time at which a customer becomes inactive appears to have a random component.
- The inclination for a customer to "drop out" of their relationship with the firm is heterogenous. In other words, some customers are expected to become inactive much sooner than others, and some may remain active for many years, well beyond the length of any conceivable data set.
- Purchase rates (while a customer is active) and drop out rates vary independently across customers.
The authors develop a formal model for lifetime value because the observed data is sparse and therefore unreliable.
These calculations give us the expected lifetime number of transactions from a customer. To calculate the lifetime value, we also need a model for the expected value of the transactions. The assumptions are:
- The dollar value of a customer's transaction varies randomly around his average.
- Average transaction values vary across customers but not over time.
- The distribution of average transaction values is independent of the transaction process.
Closed-form expression: A mathematical expression that can be evaluated in a finite number of operations. Usually, if an expression contains a limit function, it is not closed form.
Convolution: A function derived from two given functions by integration that expresses how the shape of one is modified by the other.
Instead of the log-normal distribution, they choose the gamma distribution, adapting the gamma-gamma model from Colombo and Jiang (1999).
The gamma distribution is a family of probability density distributions with two parameters. The exponential distribution and chi-squared distribution are two special cases of gamma distributions. There are three alternative parameterisations of a gamma distribution: shape and scale, shape and rate, or shape and mean.
Monetary value
Why do we need a model for monetary value at all? Isn't the mean of observed values sufficient? We cannot necessarily trust the observed value m.x because of potential outliers skewing individual results. If a customer has made a payment with a size far away from the mean, we want to debias the forecast. The monetary value of each transaction is denoted by z.1, z.2 ... z.x. As x approach infinity, the observed mean transaction value m.x approaches the true mean E(M). We expect this to be a slow process and one which the typical sparse transaction data set is far from approximating.
- Z.i is assumed to be i.i.d. gamma variables with shape parameter p and scale parameter v.
- A gamma (px, v) random variable multiplied by the scalar 1/x is also has a gamma distribution with shape parameter px and scale parameter vx.
The individual-level distribution of m.x is given by f(m.x | p, v, x) = ( (v x)^(p x) m.x^(p x-1) e^(-v x m.x) ) / Gamma(p x).
The expected monetary value E(M) is a weighed mean of the observed monetary value m.x and the population mean. More transactions (a higher value of x) leads to more weight being placed on the individual observed mean.
A marginal distribution is the probability distribution of several variables combined. The variables are also a subset of a larger set of variables. The term marginal came about because they used to be found by summing values in tables along rows or columns in the margin of the table.
Sources
“Counting Your Customers” the Easy Way: An Alternative to the Pareto/NBD Model
RFM and CLV: Using Iso-Value Curves for Customer Base Analysis
Thursday, December 10, 2015
Coordinates of UK cities

Wednesday, December 02, 2015
Text mining sparse data sets with R and tm
If you've been playing with the documentTermMatrix from the tm package in R, you might have encountered this error:
Error in vector(typeof(x$v), nr * nc) : vector size cannot be NA
In addition: Warning message:
In nr * nc : NAs produced by integer overflow
The object containing the data is too large to be converted to a matrix. How do we get around this? We need to remove sparse items.
corp <- ectorsource="" nbsp="" orpus="" x="">% tm_map(content_transformer(tolower)) %>% tm_map(stripWhitespace) %>% tm_map(stemDocument) %>% tm_map(removePunctuation)
dtm <- corp2="" documenttermmatrix="" p="">density <- length="ncol(dtm))</p" vector="">for(i in 1:ncol(dtm))
density[i] <- dtm="" i="" j="" length="" p="">
r <- density="" which=""> 10)
m <- as.matrix="" dtm="" p="" r="">v <- colsums="" decreasing="TRUE)</p" m="" sort="">d <- data.frame="" word="names(v),freq=v)</p">wordcloud(words<- d="" freq="" p="" word="">
Monday, October 26, 2015
Machine learning stack
These are the languages and technologies that will make it easy for you to deploy products based on machine learning to production.
Here are the six technologies you will need to build a machine learning product from scratch; AngularJS, HTML5, NodeJS, MySQL, Cassandra and R.
AngularJS
AngularJS is a great tool to have in your data scientist kit. It allows you to extend HTML to work in entirely new ways. It also allows you to tie your rich data structures directly to your HTML templates, using 2-way bindings.
HTML5
Knowing how to work with the HTML5 canvas makes data visualisation on the web easier.
NodeJS
Using javascript on both the front- and backend unifies the stack so that you can work with the same language and data structure, simplifying development. Node makes it possible to create real-time websites with push capability. This is great for serving live data to the web page.
MySQL
While there are many database options available, MySQL is tried and tested and is very efficient for most data sets.
Cassandra
At some point, MySQL stops scaling and you need something else. That is Cassandra.
R
R is probably the best tool for model testing with access to all the latest machine learning techniques.
Friday, October 16, 2015
Three tips when using a Random Forest in R
1. Make sure to have either factors or numeric variables in the regression. No strings allowed!
2. Make sure that you have a reasonable number of factors. About six should do the trick.
3. Reduce your sample size and the number of trees when testing. You only need a large number of trees to avoid overfitting. If your model is underperforming with a small number of trees, your problem isn't overfitting.
Monday, October 12, 2015
O'Reilly on technology and work
"Free market Economics is like the poetry of Alexander Pope."
"Books were always available only to a small percentage of the population."
"Will books go the way of the vinyl record? - Probably."
Business models today rarely has to face the rigor of asking "will someone pay for this?"
http://files.libertyfund.org/econtalk/y2015/OReillytechnology.mp3
Using TransferWise to save your business money
TransferWise is the cheapest, and probably fastest, way to send money abroad. But did you know you can use it for your business as well? Before you get started, you will need the following documents:


- A clear scan or photograph of your passport photo page, driver's license or a national identity card.
- A copy of a utility bill or a bank statement issued within the last 3 months. It should match the personal address entered on TransferWise
- A copy of the business’s certificate of incorporation (or any other valid business registration document).
Once you have those ready, just follow these steps to get started:
1. Sign up at TransferWise.com

2. Click the close button in the top right corner to exit the transfer screen

3. Click the figure left of the "send money" button and hit "settings".

4. Fill in your personal details and click save

5. Go to the settings page again and click "business" to fill in your business details

6. Follow the link in the orange box to verify yourself and your business


Faster BTYD
The R-library "Buy 'Til You Die" for customer equity forecasting looked promising, but I quickly realised that the implementation relies heavily on loops and is not suited for any data set bigger than a couple of thousand rows.
To speed things up, I switched out a couple of the loops for some data.table magic. Here it is, about 10000X faster than the original, but there is still some room for improvement.
If you're having trouble getting the BTYD package to run, take a look at this post for fixes.
To speed things up, I switched out a couple of the loops for some data.table magic. Here it is, about 10000X faster than the original, but there is still some room for improvement.
If you're having trouble getting the BTYD package to run, take a look at this post for fixes.
How expensive is it to buy currency at Tallinn's airport?

I was travelling back to London after a visit to our Tallinn office last Friday, and decided to take a snapshot of the currency exchange board at the airport. I always knew I was getting a bad deal at the airport currency exchange counter, but how bad is the exchange rate exactly?

Buying currency at an airport is probably the most expensive way to get your travel money. I compared the rate at the airport to what I would get from TransferWise. The difference is quite shocking.
Airport rate: 0.55 EUR/GBP
Airport fee: 0%
500 EUR * 0.55 EUR/GBP = 275 GBP
TransferWise rate: 0.74 EUR/GBP
TransferWise fee: 0.5%
500 EUR (100% - 0.5%) * 0.74 EUR/GBP= 368.15 GBP
Difference: 93 GBP.
The cost of changing money at the airport instead of using TransferWise is 93 GBP. That means you get 25% more if you're using TransferWise.
Been at an airport recently? Send me your snapshot of the exchange rate screen to erik.johansson [a] shs.fi.
Thursday, October 08, 2015
“To be a thought leader, you have to have a thought.” (Eric Schmidt, How Google Works)
“If you focus on your competition, you will never deliver anything truly innovative.”
“Voltaire wrote, “The perfect is the enemy of the good.”188 Steve Jobs told the Macintosh team that “real artists ship.”189 New ideas are never perfect right out of the chute, and you don’t have time to wait until they get there. Create a product, ship it, see how it does, design and implement improvements, and push it back out. Ship and iterate. The companies that are the fastest at this process will win.”
“A technical insight is a new way of applying technology or design that either drives down the cost or increases the functions and usability of the product by a significant factor.”
“If we have data, let’s look at data. If all we have are opinions, let’s go with mine.”
Tuesday, October 06, 2015
King Q2 earnings compared to forecast
The consensus forecast for King's Q2 2015 EPS was 0.36. Based on the amount of Google searches for King's main titles by the end of Q2, I predicted an EPS of 0.45. Now, the actuals are out, and the real numbers are somewhere in the middle.
At a realised EPS for Q2 at 0.41, the surprise against the consensus forecast was 13.89%. My estimate had a negative surprise of -9%.
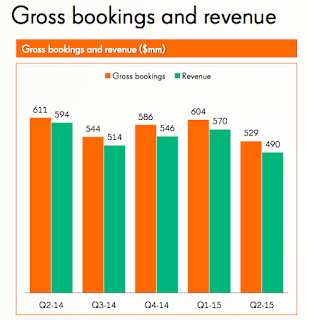
As for revenue, I forecasted Q2 revenue to be $517M. Actuals turned out to be lower by 5%, at $490M.
At a realised EPS for Q2 at 0.41, the surprise against the consensus forecast was 13.89%. My estimate had a negative surprise of -9%.
As for revenue, I forecasted Q2 revenue to be $517M. Actuals turned out to be lower by 5%, at $490M.
Thursday, September 17, 2015
Maximul Likelihood Definition
We want to maximise the likelihood of observing the data that we actually did observe.
Given a model that says how the data was generated, find the parameters that maximises the likelihood of observing that data.
Tuesday, September 08, 2015
How to speed up csv import in R
If you're storing a lot of data in csv files, reading it to R with read.csv can be painfully slow. Using the fread function from the data.table library increase read speed by 100x, so definitely check it out.
library(data.table)
data <- fread('data.csv')
If you prefer to work with a data.frame, it's easy to tell fread to save it as such as well.
data <- fread('data.csv', data.table=FALSE)
library(data.table)
data <- fread('data.csv')
If you prefer to work with a data.frame, it's easy to tell fread to save it as such as well.
data <- fread('data.csv', data.table=FALSE)
Wednesday, July 29, 2015
Google Trends shows Meerkat was a fad
Google Trends data suggests that the Meerkat video app was a fad.
Also, it never became popular outside of California, New York and London.
Also, it never became popular outside of California, New York and London.
Twitter Q3 2015 MAU growth forecast
Twitter just released their Q2 earnings, and with their stagnating user growth in mind, I wanted to take a look at their expected user growth in Q3 given the current trend in Internet search volumes for Twitter.
Past log changes in monthly active users (MAU) has had a strong correlation with log change in average quarterly search volumes. That's what we'll use for the prediction.


Past log changes in monthly active users (MAU) has had a strong correlation with log change in average quarterly search volumes. That's what we'll use for the prediction.

Then, let's assume that the current search volume trend continues into Q3 (forecasted figures in red below).

Based on the historical correlation, we can then forecast the change in MAUs from Q2 to Q3.

That should mean an average of 335 million monthly active users in Q3. If we extend the forecast to Q4, that gives us 346 million MAUs.

Twitter has stopped growing in the US, and all the growth in Q2 is from abroad. Are there any markets where search volumes trends are positive? There are stable or slightly decreasing SVI volumes in Germany, Austria, Switzerland, Japan, Australia, and New Zealand.
The trajectory is negative in France, Spain, Italy, Ukraine, Russia, Indonesia, Brazil, South Africa, Canada, and Kazakhstan.
There only places I've found with a positive trend is Portugal, Argentina and South Korea.
It will be interesting to see how actual search volume interest develops during Q3.
Monday, July 27, 2015
Has Supercell peaked?
Last year's revenue hit new record highs for the Finnish game maker, but the latest data from Google Trends show a worrying picture for their hit game "Clash of Clans".
Data from Google Trends show that interest for Clash of Clans peaked in February and has since been on a downward trajectory. The picture looks even worse if we look only at interest in the US.
Wednesday, June 24, 2015
King Q2 2015 revenue forecast. Is the saga over for King?
Update 4 August 2015
The deterioration in search volume for King's main titles in Q2 2015 wasn't as bad as forecasted, thanks to an uptick in Candy Crush popularity in the last week. The consensus forecast for King's EPS for Q2 from Nasdaq puts EPS at $0.36. Based on the latest SVI data, I would expect King's revenue to be around $517 M. An EPS of $0.36 seems quite low. I would assume it to be close to $0.45.
The mobile game developer behind the Candy Crush Saga, King, had a record year in 2014, with revenue increasing 19% from the year before. But since then, things have changed. From the search volume for their top three titles, Candy Crush, Bubble Witch and Farm Heroes, we can see that none of the other titles have really taken off. What's worse, interest in their top title Candy Crush is going down.

What could this mean for revenues 2015? Revenue is already on a down trend. If we extrapolate out the search volume trend to the end of the year, the number of Google searches will have decreased by 43%.

The end of 2015 is of course half a year away, but if the trend continues, we should see a drop in King's revenue by 50% to $1105 M.


If we look a bit closer in time, ahead for Q2 2015, the same analysis puts revenue at $454 M. for the quarter. If we remove the first quarter 2013, that number goes up to $550, on par with the previous quarter.

The analysis is based on the assumption that Google searches equals general interest which translates into revenue. It's limited by the fact that Candy Crush accounts only for 50% of revenue, but is 95% of the search volume variation measure used here. A drop in new users wouldn't either translate into a direct drop in revenue, as existing users keep playing King's game.
The time of explosive growth looks to be over for King. If you have the analyst's revenue forecast for Q2, leave a note in the comments. How do you think the stock market will react to a continued revenue decline in Q2 2015?
Rovio forecasted revenue 2014 versus actuals
Back in March, I claimed that Rovio's revenue would decline from €153.5 M. to €152 M. The actuals are out, and it seems like I was only off by €4 M. Even better, the model could forecast a change in trend based on Google search data, which is very interesting to see.
The model used was slightly different from the one used for forecasting Supercell's revenue for the year. Previously I have worked with the direct correlation between revenue and search volume. This time, a log change model was instead used, and proved to be effective in this case.
Here's the previous post containing the forecast.
Financial ratio summary
Rovio Entertainment Oy
|
2010/12
|
2011/12
|
2012/12
|
2013/12
|
2014/12
|
|---|---|---|---|---|---|
Companys turnover (1000 EUR)
| 5232 | 75395 | 152171 | 153516 | 148332 |
Turnover change %
| 622.10 | 620.60 | 101.80 | 0.90 | -3.40 |
Result of the financial period (1000 EUR)
| 2600 | 35356 | 55615 | 25898 | 7964 |
Operating profit %
| 56.60 | 62.10 | 50.50 | 22.80 | 6.70 |
Company personnel headcount
| - | 98 | 311 | 547 | 729 |
Sunday, June 21, 2015
How to calculate the virality coefficient in SQL
One of the most powerful way to grow an online business is through word of mouth. Cohort analysis is a powerful way to understand how effective you are at turning users into advocates. The number of users brought in by an invite program is called the virality coefficient. It measures how many guests (new users) your hosts (existing users) are bringing in. Depending on your business, you will be more concerned with the new user virality coefficient, or the active user virality coefficient. Here, I explain how to calculate a generic one week new user virality coefficient with SQL.
Invite_table
Host_id
Guest_id
Guest_first_payment_date
User table
Id
Sign_up_date
First_payment_date
select
date_format(user_table. first_payment_date, '%x-%v')
, count(user_table.first_payment_date)
from user_table
group by 1
By using %x instead of %Y to calculate the year, we make sure to calculate the year correctly even when the year changes.
Since the date of the host's first payment is stored in user_table, we need to do a join to be able to calculate the difference.
select
invite_table.host_id
,sum(case when
datediff(invite_table.guest_first_payment_date, user_table.first_payment_date) <=7
then 1
else 0
end) as individual_one_week_vc
from invite_table
join user_table
on user_table.id = invite_table.host_id
group by 1
First, some definitions
- Host: An existing user.
- Guest: A potential users that has been invited by a host.
- Conversion: In this case, we define conversion as making a payment.
- Cohort: A collection of host that share some attribute. If we are calculating the new user virality coefficient, the shared attribute is that they converted in the same time frame.
- Time limit: To make the data comparable across cohorts, we must look at the same time frame. Here, we use one week. If you are familiar with cohort tables, they show the value across several time periods.
- One week new user virality coefficient = Number of converted guests by an existing user within one week of that user converting themselves
- 1wnuvc=(guests,1w | host)/hosts
What the database is assumed to contain
A typical database structure for an invite program could look something like this:Invite_table
Host_id
Guest_id
Guest_first_payment_date
User table
Id
Sign_up_date
First_payment_date
Step 1
First we define what cohort we want to measure. In this example, we will define a cohort as the week of the first payment.select
date_format(user_table. first_payment_date, '%x-%v')
, count(user_table.first_payment_date)
from user_table
group by 1
By using %x instead of %Y to calculate the year, we make sure to calculate the year correctly even when the year changes.
Step 2
We then calculate the virality coefficient per host within given time frame. Let's say we want to measure the one week virality coefficient. The case statement checks if the difference between the conversion of the guest and the host is less than seven days and only counts those cases.Since the date of the host's first payment is stored in user_table, we need to do a join to be able to calculate the difference.
select
invite_table.host_id
,sum(case when
datediff(invite_table.guest_first_payment_date, user_table.first_payment_date) <=7
then 1
else 0
end) as individual_one_week_vc
from invite_table
join user_table
on user_table.id = invite_table.host_id
group by 1
Step 3
Finally, we combine the two. The virality coefficient for the weekly cohort is calculated as the sum of the individual virality coefficient, divided by the number of hosts in the cohort.
select
date_format(user_table. first_payment_date, '%x-%v')
,count(user_table. first_payment_date)
,sum(conversions.individual_one_week_vc)/count(user_table. first_payment_date) as one_week_virality_vc
from user_table
left join (
select
invite_table.host_id
,sum(case when
datediff(invite_table.guest_first_payment_date, user_table.first_payment_date) <=7
then 1
else 0
end) as individual_one_week_vc
from invite_table
join user_table
on user_table.id = invite_table.host_id
group by 1
group by 1
date_format(user_table. first_payment_date, '%x-%v')
,count(user_table. first_payment_date)
,sum(conversions.individual_one_week_vc)/count(user_table. first_payment_date) as one_week_virality_vc
from user_table
left join (
select
invite_table.host_id
,sum(case when
datediff(invite_table.guest_first_payment_date, user_table.first_payment_date) <=7
then 1
else 0
end) as individual_one_week_vc
from invite_table
join user_table
on user_table.id = invite_table.host_id
group by 1
) conversions
on conversions.host_id=user_table.id
group by 1
Friday, May 22, 2015
International invoicing for businesses
If you are accepting bank transfers from customers abroad, you are likely to face steep bank fees. To get an idea of how much you could save by using an alternative payment provider such as TransferWise, look at the example below. On a £1000 transaction, you get €60 more with TransferWise.
| Savings calculator | Total |
|---|---|
| Amount to convert | £ |
| Your savings | € |
| TransferWise | Your average bank | |
|---|---|---|
| GBP/EUR | ||
| Fees | £ | |
| You get | € |
Thursday, May 21, 2015
TransferWise's community visualized
Click image for high-res version.
From the TransferWise blog:
As TransferWise grows we notice something pretty special – our members love sharing the service with friends. To say thanks, the TransferWise referral programme was born. Now, you’re rewarded if you refer a friend to TransferWise.
Created with R and Gephi.
Tuesday, March 24, 2015
Rovio revenue estimate 2014
Is there a correlation between Rovio's revenue and the amount of Google searches for their most popular title Angry Birds? Admittedly, we only have three data points to go on, but they do line up nicely. The upper chart plots the log change in search volume (x-axis) against revenue (y-axis). Based on that correlation, Rovio's revenue should decline somewhat in 2014, to 152 million €.

Supercell revenue 2014 is 1.55 billion €, compared to forecasted 1.7 billion €
How powerful is Google Trends for predicting revenue of Internet compaines? This is just one data point, but my previous prediction for Supercell's 2014 revenue was not far off.
Supercell's revenue for 2014 was 1.55 billion €, compared to my prediction of 1.7 billion €.

The next prediction I have my eye on is for the Apple Watch. Google Trends data suggests that the Apple Watch will sell well below what market analysts expect. While the launch of the Apple Watch did create some buzz on search engines, that quickly died out.
Another mobile games company from Finland is Rovio. If would be interesting to see if the correlation holds up for them as well. It's not looking good.
Supercell's revenue for 2014 was 1.55 billion €, compared to my prediction of 1.7 billion €.
The next prediction I have my eye on is for the Apple Watch. Google Trends data suggests that the Apple Watch will sell well below what market analysts expect. While the launch of the Apple Watch did create some buzz on search engines, that quickly died out.
Another mobile games company from Finland is Rovio. If would be interesting to see if the correlation holds up for them as well. It's not looking good.
Monday, March 09, 2015
Apple Watch sales prediction based on Google Trends data
Back in September 2014, I estimated that the unit sales of the Apple Watch will be 2700 000 in the first three months of sales. The number is based on the correlation between Google searches around the announcement for the iPhone and iPad. Later on in October I revised the number down to 400 000 based on low interest for the product.
When compared to the interest in the iPhone and iPad, the Apple Watch is still lagging behind. In fact, the iPod generates more Google Searches than the Apple Watch.
Industry analysts expect Apple to sell between 10-30 million watches in the first year, or 4-7.5 million per quarter. Even if 400 000 is way too low, the low search interest for the watch indicates that sales will be lower than what analysts predict.
Google Trends data is always two days behind, so we will have to wait until Wednesday to see how the Apple Watch launch compares to the iPad and iPhone. So far, it doesn't look great.
More on the methodology
Friday, January 30, 2015
TransferWise's hockey stick growth according to Google Trends
To get a free transfer from TransferWise, use this link.
Wednesday, January 07, 2015
Finland's most connected companies
How are the decision makers of listed companies in Finland connected? Using R for collecting decision maker data and D3 for visualizing the results, I have created this network chart (sorry for the ugly iframe):
Connections are the number of connections to other boards from one company to other. KONE's board members are for instance on 13 other boards. The most connected companies on Helsinki's stock exchange are Kone, Sponda and Teleste.
The data has been filtered out so that only companies with at least one connection to another company are included. The data is collected from finder.fi and includes the company's management, board members, and other people with the right to sign for the company.
Connections are the number of connections to other boards from one company to other. KONE's board members are for instance on 13 other boards. The most connected companies on Helsinki's stock exchange are Kone, Sponda and Teleste.
| Company | Connections |
| KONE Oyj | 13 |
| Sponda Oyj | 12 |
| Teleste Oyj | 10 |
| Outotec Oyj | 10 |
| Cargotec Oyj | 10 |
The data has been filtered out so that only companies with at least one connection to another company are included. The data is collected from finder.fi and includes the company's management, board members, and other people with the right to sign for the company.
Tuesday, January 06, 2015
Network chart of board members in Helsinki
The data is scraped from the Finnish business directory finder.fi. The network chart is created using D3.js.
Friday, January 02, 2015
Supercell revenue estimate 2014
I've previously used Google Trends to estimate revenues, and I will give it another go here for the Finnish gaming company Supercell. I've gathered the combined search volume for Hay Day, Clash of Clans, and Boom Beach.
Based on the search volume, the new game Boom Beach has not yet exceeded the interest in Supercell's first game Hay Day, and is still a long way off from matching the success of Clash of Clans. The trend is however positive. The interest in Clash of Clans has continued increasing.
The total search volume for all three games has increase 330 % as compared to 2013. Based on the past correlation between revenue and search volume, I estimate Supercell's revenue to be 1.7 billions 2014.
The graph above plots the weekly search volume index summed by year against the official yearly revenue figures. The green dot represents the estimate for 2014.
Subscribe to:
Posts (Atom)
